edtools Demo
edtools is a python package for automated processing of a large number of 3D electron diffraction (3D ED) datasets. It can be downloaded from https://doi.org/10.5281/zenodo.6952810.
For runing edtools, XDS package for reduction of 3D ED datasets is required. XDS package is available at https://xds.mr.mpg.de/html_doc/downloading.html.
A typical cycle of using edtools for processing batch 3D ED datasets goes through the following steps:
edtools.autoindexedtools.extract_xds_infoedtools.find_celledtools.update_xdsedtools.make_xscaleedtools.cluster
Here we demonstrate the processing of batch 3D ED datasets for phase analysis and structure determination using edtools. The datasets for the demo can be downloaded from https://zenodo.org/record/6533426#.YnoQ7_hBxaQ.
The datasets were collected on a zeolite mixture sample using serial rotation electron diffraction (SerialRED) data collection technique implemented in the program Instamatic (available at https://doi.org/10.5281/zenodo.5175957), which runs on a JEOL JEM-2100-LaB6 at 200 kV equipped with a 512 x 512 Timepix hybrid pixel detector (55 x 55 µm pixel size, QTPX-262k, Amsterdam Scientific Instruments).
The zeolite mixture sample contains phases IWV,RTH, and *CTH. The information of these three phases can be found from the structure database of zeolites (https://europe.iza-structure.org/IZA-SC/ftc_table.php).
This demo takes around 5-10 min to run on a normal desktop computer with all the required packages installed properly beforehand.
Indexing
Automatically index the 3D ED datasets by running XDS in all subfolders (SMV) that contains file XDS.INP, which is automatically generated during data collection using Instamatic.
[1]:
!edtools.autoindex
 !!! ERROR !!! WRONG TYPE OF INPUT FILE SPECIFIED
 !!! ERROR !!! WRONG TYPE OF INPUT FILE SPECIFIED
16 files named XDS.INP (subdir: None) found.

   0: C:\demo\edtools_demo_data\stagepos_0067\crystal_0001\SMV  # Mon Aug  1 21:00:56 2022
Spgr    5 - Cell      26.93     14.05      5.36     90.00     90.89     90.00 - Vol    2027.80

   #   dmax  dmin    ntot   nuniq   compl   i/sig   rmeas CC(1/2)     ISa   B(ov)
   #   dmax  dmin    ntot   nuniq   compl   i/sig   rmeas CC(1/2)     ISa   B(ov)
---------------------------------------------------------------------------------
   0   4.35  0.80     583     324    15.0    4.59    13.7    99.0    7.47    6.72
   -   0.85  0.80      54      42    12.5    1.96    26.8    91.9


   1: C:\demo\edtools_demo_data\stagepos_0164\crystal_0000\SMV  # Mon Aug  1 21:00:58 2022
Spgr    1 - Cell       9.49      9.90     12.47     66.56     89.45     86.35 - Vol    1072.59

   #   dmax  dmin    ntot   nuniq   compl   i/sig   rmeas CC(1/2)     ISa   B(ov)
   1   6.39  0.80     229     209     4.8   24.01    22.3    96.3   50.00    4.74
   -   0.91  0.85      31      29     4.5   12.16    21.3     0.0


   3: C:\demo\edtools_demo_data\stagepos_0299\crystal_0001\SMV  # Mon Aug  1 21:01:00 2022
Spgr    1 - Cell       4.83     14.83     16.03    115.66     89.61     94.16 - Vol    1031.87

   #   dmax  dmin    ntot   nuniq   compl   i/sig   rmeas CC(1/2)     ISa   B(ov)
   3   2.05  0.80     400     312     7.5    2.44    20.6    95.2    4.24    6.11
   -   0.84  0.80      27      26     4.7    1.79    11.2     0.0


   4: C:\demo\edtools_demo_data\stagepos_0325\crystal_0000\SMV  # Mon Aug  1 21:01:02 2022
Spgr    5 - Cell      13.69     25.42     14.90     90.00    115.84     90.00 - Vol    4666.87

   #   dmax  dmin    ntot   nuniq   compl   i/sig   rmeas CC(1/2)     ISa   B(ov)
   4  11.09  0.79    3744    2147    42.8    3.44    13.1    99.6   13.90    8.10
   -   0.97  0.90     623     336    47.9    1.32    68.9    84.7


   5: C:\demo\edtools_demo_data\stagepos_0341\crystal_0000\SMV  # Mon Aug  1 21:01:03 2022
Spgr    5 - Cell      25.67     13.50     17.73     90.00    132.44     90.00 - Vol    4534.43

   #   dmax  dmin    ntot   nuniq   compl   i/sig   rmeas CC(1/2)     ISa   B(ov)
   5   6.86  0.80    2161    1081    21.8    4.23    10.5    99.9   33.30    8.74
   -   0.97  0.90     342     159    23.3    0.83   130.3    69.6


   6: C:\demo\edtools_demo_data\stagepos_0368\crystal_0001\SMV  # Mon Aug  1 21:01:05 2022
Spgr    1 - Cell      10.17     10.36     12.16     93.71    113.40     98.01 - Vol    1154.16

   #   dmax  dmin    ntot   nuniq   compl   i/sig   rmeas CC(1/2)     ISa   B(ov)
   6  10.17  0.80     611     443     9.4    3.17    14.9    97.5    5.07    4.64
   -   0.85  0.80      56      53     7.0    1.96    73.1     6.4


   7: C:\demo\edtools_demo_data\stagepos_0538\crystal_0000\SMV  # Mon Aug  1 21:01:06 2022
Spgr    1 - Cell      10.55     10.52     11.81     80.39     66.60     75.74 - Vol    1162.33

   #   dmax  dmin    ntot   nuniq   compl   i/sig   rmeas CC(1/2)     ISa   B(ov)
   7   5.10  0.80     443     330     7.0    3.80    10.7    99.4    8.61    5.62
   -   0.85  0.80      38      36     4.8    1.80    76.5     0.0


   8: C:\demo\edtools_demo_data\stagepos_0648\crystal_0001\SMV  # Mon Aug  1 21:01:07 2022
Spgr    1 - Cell      13.82     14.32     16.18     86.20    111.75    116.39 - Vol    2645.41

   #   dmax  dmin    ntot   nuniq   compl   i/sig   rmeas CC(1/2)     ISa   B(ov)
   8   6.37  0.80    1460     989     9.1    2.88    16.3    97.8    5.24    7.62
   -   0.85  0.80     166     125     7.3    1.36    62.8    56.0


   9: C:\demo\edtools_demo_data\stagepos_0849\crystal_0000\SMV  # Mon Aug  1 21:01:08 2022
Spgr    5 - Cell      15.06     26.22     15.41     90.00    118.30     90.00 - Vol    5357.50

   #   dmax  dmin    ntot   nuniq   compl   i/sig   rmeas CC(1/2)     ISa   B(ov)
   9  13.11  0.79    2063    1319    22.1    3.46    10.5    99.6   12.09    7.58
   -   0.89  0.83     326     223    24.5    1.01    53.6    83.4


  10: C:\demo\edtools_demo_data\stagepos_0905\crystal_0000\SMV  # Mon Aug  1 21:01:10 2022
Spgr    3 - Cell      13.91      5.07     14.97     90.00    117.96     90.00 - Vol     932.53

   #   dmax  dmin    ntot   nuniq   compl   i/sig   rmeas CC(1/2)     ISa   B(ov)
  10  12.33  0.80     479     300    13.8    3.68    13.4    99.6   16.07    9.46
   -   1.20  1.07      58      35    14.6    4.72    24.9    88.5


  11: C:\demo\edtools_demo_data\stagepos_0905\crystal_0001\SMV  # Mon Aug  1 21:01:11 2022
Spgr    1 - Cell      13.71     14.57     15.77     83.07     68.29     62.34 - Vol    2587.36

   #   dmax  dmin    ntot   nuniq   compl   i/sig   rmeas CC(1/2)     ISa   B(ov)
  11  11.49  0.80    1596    1144    10.7    3.30    12.4    98.5    7.24    7.18
   -   0.85  0.80     124     121     7.0    0.94    22.6    83.4


  12: C:\demo\edtools_demo_data\stagepos_0980\crystal_0000\SMV  # Mon Aug  1 21:01:13 2022
Spgr    1 - Cell      14.56     15.00     15.27     97.22    105.97    120.36 - Vol    2621.77

   #   dmax  dmin    ntot   nuniq   compl   i/sig   rmeas CC(1/2)     ISa   B(ov)
  12   7.54  0.80    1746    1222    11.3    4.00    13.3    98.6    8.77    5.85
   -   0.85  0.80     164     146     8.4    1.48    36.5    86.5


  13: C:\demo\edtools_demo_data\stagepos_1014\crystal_0000\SMV  # Mon Aug  1 21:01:14 2022
Spgr    1 - Cell       5.30     14.56     15.04    112.06     93.44     86.65 - Vol    1072.87

   #   dmax  dmin    ntot   nuniq   compl   i/sig   rmeas CC(1/2)     ISa   B(ov)
  13   5.01  0.81     447     328     7.5    4.11    10.9    98.5    6.65    6.67
   -   0.85  0.80      51      44     6.3    2.11    18.7    92.7


  15: C:\demo\edtools_demo_data\stagepos_1283\crystal_0001\SMV  # Mon Aug  1 21:01:17 2022
Spgr    1 - Cell      13.64     15.02     25.09     93.07     91.13    114.33 - Vol    4672.25

   #   dmax  dmin    ntot   nuniq   compl   i/sig   rmeas CC(1/2)     ISa   B(ov)
  15   6.60  0.80    3124    2149    11.3    3.54     8.4    99.5   12.64    6.94
   -   0.85  0.80     346     280     9.2    1.24    56.2    84.9
Extract cell
Extract the determined unit cell parameters from the output files (CORRECT.LP) of XDS
[2]:
!edtools.extract_xds_info
14 files named CORRECT.LP (subdir: None) found.
   1: C:\demo\edtools_demo_data\stagepos_0067\crystal_0001\SMV  # Mon Aug  1 21:00:56 2022
Spgr    5 - Cell      26.93     14.05      5.36     90.00     90.89     90.00 - Vol    2027.80

   2: C:\demo\edtools_demo_data\stagepos_0164\crystal_0000\SMV  # Mon Aug  1 21:00:58 2022
Spgr    1 - Cell       9.49      9.90     12.47     66.56     89.45     86.35 - Vol    1072.59

   3: C:\demo\edtools_demo_data\stagepos_0299\crystal_0001\SMV  # Mon Aug  1 21:01:00 2022
Spgr    1 - Cell       4.83     14.83     16.03    115.66     89.61     94.16 - Vol    1031.87

   4: C:\demo\edtools_demo_data\stagepos_0325\crystal_0000\SMV  # Mon Aug  1 21:01:02 2022
Spgr    5 - Cell      13.69     25.42     14.90     90.00    115.84     90.00 - Vol    4666.87

   5: C:\demo\edtools_demo_data\stagepos_0341\crystal_0000\SMV  # Mon Aug  1 21:01:03 2022
Spgr    5 - Cell      25.67     13.50     17.73     90.00    132.44     90.00 - Vol    4534.43

   6: C:\demo\edtools_demo_data\stagepos_0368\crystal_0001\SMV  # Mon Aug  1 21:01:05 2022
Spgr    1 - Cell      10.17     10.36     12.16     93.71    113.40     98.01 - Vol    1154.16

   7: C:\demo\edtools_demo_data\stagepos_0538\crystal_0000\SMV  # Mon Aug  1 21:01:06 2022
Spgr    1 - Cell      10.55     10.52     11.81     80.39     66.60     75.74 - Vol    1162.33

   8: C:\demo\edtools_demo_data\stagepos_0648\crystal_0001\SMV  # Mon Aug  1 21:01:07 2022
Spgr    1 - Cell      13.82     14.32     16.18     86.20    111.75    116.39 - Vol    2645.41

   9: C:\demo\edtools_demo_data\stagepos_0849\crystal_0000\SMV  # Mon Aug  1 21:01:08 2022
Spgr    5 - Cell      15.06     26.22     15.41     90.00    118.30     90.00 - Vol    5357.50

  10: C:\demo\edtools_demo_data\stagepos_0905\crystal_0000\SMV  # Mon Aug  1 21:01:10 2022
Spgr    3 - Cell      13.91      5.07     14.97     90.00    117.96     90.00 - Vol     932.53

  11: C:\demo\edtools_demo_data\stagepos_0905\crystal_0001\SMV  # Mon Aug  1 21:01:11 2022
Spgr    1 - Cell      13.71     14.57     15.77     83.07     68.29     62.34 - Vol    2587.36

  12: C:\demo\edtools_demo_data\stagepos_0980\crystal_0000\SMV  # Mon Aug  1 21:01:13 2022
Spgr    1 - Cell      14.56     15.00     15.27     97.22    105.97    120.36 - Vol    2621.77

  13: C:\demo\edtools_demo_data\stagepos_1014\crystal_0000\SMV  # Mon Aug  1 21:01:14 2022
Spgr    1 - Cell       5.30     14.56     15.04    112.06     93.44     86.65 - Vol    1072.87

  14: C:\demo\edtools_demo_data\stagepos_1283\crystal_0001\SMV  # Mon Aug  1 21:01:17 2022
Spgr    1 - Cell      13.64     15.02     25.09     93.07     91.13    114.33 - Vol    4672.25

   #   dmax  dmin    ntot   nuniq   compl   i/sig   rmeas CC(1/2)     ISa   B(ov)
---------------------------------------------------------------------------------

   1   4.35  0.80     583     324    15.0    4.59    13.7    99.0    7.47    6.72  # C:\demo\edtools_demo_data\stagepos_0067\crystal_0001\SMV\CORRECT.LP
   -   0.85  0.80      54      42    12.5    1.96    26.8    91.9

   2   6.39  0.80     229     209     4.8   24.01    22.3    96.3   50.00    4.74  # C:\demo\edtools_demo_data\stagepos_0164\crystal_0000\SMV\CORRECT.LP
   -   0.91  0.85      31      29     4.5   12.16    21.3     0.0

   3   2.05  0.80     400     312     7.5    2.44    20.6    95.2    4.24    6.11  # C:\demo\edtools_demo_data\stagepos_0299\crystal_0001\SMV\CORRECT.LP
   -   0.84  0.80      27      26     4.7    1.79    11.2     0.0

   4  11.09  0.79    3744    2147    42.8    3.44    13.1    99.6   13.90    8.10  # C:\demo\edtools_demo_data\stagepos_0325\crystal_0000\SMV\CORRECT.LP
   -   0.97  0.90     623     336    47.9    1.32    68.9    84.7

   5   6.86  0.80    2161    1081    21.8    4.23    10.5    99.9   33.30    8.74  # C:\demo\edtools_demo_data\stagepos_0341\crystal_0000\SMV\CORRECT.LP
   -   0.97  0.90     342     159    23.3    0.83   130.3    69.6

   6  10.17  0.80     611     443     9.4    3.17    14.9    97.5    5.07    4.64  # C:\demo\edtools_demo_data\stagepos_0368\crystal_0001\SMV\CORRECT.LP
   -   0.85  0.80      56      53     7.0    1.96    73.1     6.4

   7   5.10  0.80     443     330     7.0    3.80    10.7    99.4    8.61    5.62  # C:\demo\edtools_demo_data\stagepos_0538\crystal_0000\SMV\CORRECT.LP
   -   0.85  0.80      38      36     4.8    1.80    76.5     0.0

   8   6.37  0.80    1460     989     9.1    2.88    16.3    97.8    5.24    7.62  # C:\demo\edtools_demo_data\stagepos_0648\crystal_0001\SMV\CORRECT.LP
   -   0.85  0.80     166     125     7.3    1.36    62.8    56.0

   9  13.11  0.79    2063    1319    22.1    3.46    10.5    99.6   12.09    7.58  # C:\demo\edtools_demo_data\stagepos_0849\crystal_0000\SMV\CORRECT.LP
   -   0.89  0.83     326     223    24.5    1.01    53.6    83.4

  10  12.33  0.80     479     300    13.8    3.68    13.4    99.6   16.07    9.46  # C:\demo\edtools_demo_data\stagepos_0905\crystal_0000\SMV\CORRECT.LP
   -   1.20  1.07      58      35    14.6    4.72    24.9    88.5

  11  11.49  0.80    1596    1144    10.7    3.30    12.4    98.5    7.24    7.18  # C:\demo\edtools_demo_data\stagepos_0905\crystal_0001\SMV\CORRECT.LP
   -   0.85  0.80     124     121     7.0    0.94    22.6    83.4

  12   7.54  0.80    1746    1222    11.3    4.00    13.3    98.6    8.77    5.85  # C:\demo\edtools_demo_data\stagepos_0980\crystal_0000\SMV\CORRECT.LP
   -   0.85  0.80     164     146     8.4    1.48    36.5    86.5

  13   5.01  0.81     447     328     7.5    4.11    10.9    98.5    6.65    6.67  # C:\demo\edtools_demo_data\stagepos_1014\crystal_0000\SMV\CORRECT.LP
   -   0.85  0.80      51      44     6.3    2.11    18.7    92.7

  14   6.60  0.80    3124    2149    11.3    3.54     8.4    99.5   12.64    6.94  # C:\demo\edtools_demo_data\stagepos_1283\crystal_0001\SMV\CORRECT.LP
   -   0.85  0.80     346     280     9.2    1.24    56.2    84.9

Wrote 14 cells to file cells.xlsx
Wrote 14 cells to file cells.yaml
Wrote 8 entries to file filelist.txt (completeness > 10.0%, CC(1/2) > 90.0%)

Most likely lattice types:
  1 Lattice type `aP` (spgr:   1) was found   9 times (score:   10056)
  2 Lattice type `mC` (spgr:   5) was found   4 times (score:    8551)
  3 Lattice type `mP` (spgr:   3) was found   1 times (score:     479)

 ** the score corresponds to the total number of indexed reflections.
Unit-cell-based clustering for phase analysis
[ ]:
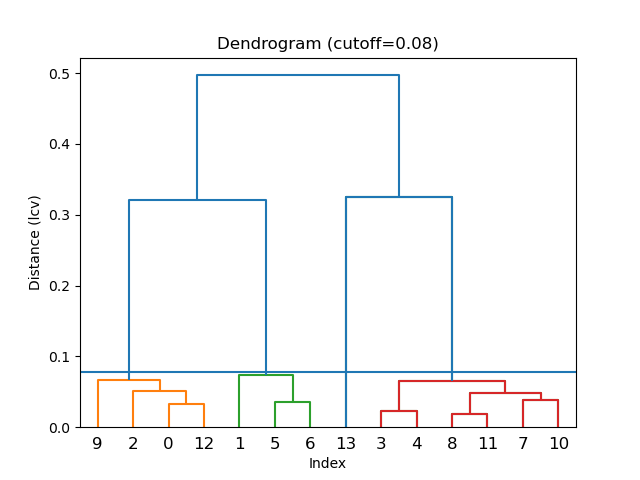
!edtools.find_cell cells.yaml -s --cluster --metric lcv
[3]:
from IPython.display import Image
Image('find_cell_step3.png', embed=True)
[3]:
Console Output
Linkage method = average
Cutoff distance = 0.078
Distance metric = lcv

----------------------------------------

Cluster #1 (4 items)
    1 [   5.47   14.07   15.30   63.22   87.59   88.58]  Vol.: 1050.9
    3 [   5.33   14.99   16.06   64.44   89.16   82.51]  Vol.: 1144.9
   10 [   5.05   14.37   14.53   62.13   88.52   89.11]  Vol.:  932.0
   13 [   5.30   14.89   15.18   66.79   86.51   86.59]  Vol.: 1098.1
 ---
Mean: [   5.29   14.58   15.27   64.15   87.95   86.70]  Vol.: 1056.5
 Min: [   5.05   14.07   14.53   62.13   86.51   82.51]  Vol.:  932.0
 Max: [   5.47   14.99   16.06   66.79   89.16   89.11]  Vol.: 1144.9

Cluster #2 (3 items)
    2 [   9.52    9.98   12.85   65.60   87.80   85.43]  Vol.: 1107.8
    6 [  10.21   10.36   12.08   85.86   67.02   81.83]  Vol.: 1165.3
    7 [  10.55   10.75   11.75   80.34   66.42   75.73]  Vol.: 1179.4
 ---
Mean: [  10.09   10.36   12.23   77.27   73.75   81.00]  Vol.: 1150.9
 Min: [   9.52    9.98   11.75   65.60   66.42   75.73]  Vol.: 1107.8
 Max: [  10.55   10.75   12.85   85.86   87.80   85.43]  Vol.: 1179.4

Cluster #3 (6 items)
    4 [  14.04   14.39   14.72   76.68   62.79   61.86]  Vol.: 2331.3
    5 [  13.50   14.38   14.63   75.73   64.60   63.07]  Vol.: 2283.0
    8 [  13.89   14.29   17.00   72.43   63.61   63.57]  Vol.: 2684.8
    9 [  14.81   15.07   15.52   62.45   74.78   62.16]  Vol.: 2711.1
   11 [  13.73   14.56   16.03   84.26   68.05   62.57]  Vol.: 2629.5
   12 [  14.43   14.90   15.40   81.24   74.01   61.15]  Vol.: 2787.8
 ---
Mean: [  14.07   14.60   15.55   75.46   67.97   62.40]  Vol.: 2571.3
 Min: [  13.50   14.29   14.63   62.45   62.79   61.15]  Vol.: 2283.0
 Max: [  14.81   15.07   17.00   84.26   74.78   63.57]  Vol.: 2787.8

Wrote cluster 1 to file `cells_cluster_1_4-items.yaml`
Wrote cluster 2 to file `cells_cluster_2_3-items.yaml`
Wrote cluster 3 to file `cells_cluster_3_6-items.yaml`
The three resulted clusters 1, 2, 3 correspond to phases *CTH, RTH, and IWV, respectively.
With the averaged primitive unit cell parameters of each cluster, one can use the online tool http://cci.lbl.gov/cctbx/lattice_symmetry.html to find unit cell with higher symmetry with a pre-set tolerance.
We take cluster 3 (phase IWV) as an example. The averaged unit cell parameters are: 14.07, 14.6, 15.55, 75.46, 67.97, 62.40
The unit cell parameters with a higher symmetry (space group: Fmmm (69)) are: 14.07, 25.8828, 28.9294, 90, 90, 90
The same operation can be done for all the other clusters.
Update the XDS.INP files
This step used edtools.update_xds to update the XDS input files with the determined unit cell parameters and space group.
[4]:
!edtools.update_xds -c 14.07 25.8828 28.9294 90 90 90 -s 69
16 files named XDS.INP (subdir: None) found.
 C:\demo\edtools_demo_data\stagepos_0067\crystal_0001\SMV\XDS.INP
 C:\demo\edtools_demo_data\stagepos_0164\crystal_0000\SMV\XDS.INP
 C:\demo\edtools_demo_data\stagepos_0290\crystal_0002\SMV\XDS.INP
 C:\demo\edtools_demo_data\stagepos_0299\crystal_0001\SMV\XDS.INP
 C:\demo\edtools_demo_data\stagepos_0325\crystal_0000\SMV\XDS.INP
 C:\demo\edtools_demo_data\stagepos_0341\crystal_0000\SMV\XDS.INP
 C:\demo\edtools_demo_data\stagepos_0368\crystal_0001\SMV\XDS.INP
 C:\demo\edtools_demo_data\stagepos_0538\crystal_0000\SMV\XDS.INP
 C:\demo\edtools_demo_data\stagepos_0648\crystal_0001\SMV\XDS.INP
 C:\demo\edtools_demo_data\stagepos_0849\crystal_0000\SMV\XDS.INP
 C:\demo\edtools_demo_data\stagepos_0905\crystal_0000\SMV\XDS.INP
 C:\demo\edtools_demo_data\stagepos_0905\crystal_0001\SMV\XDS.INP
 C:\demo\edtools_demo_data\stagepos_0980\crystal_0000\SMV\XDS.INP
 C:\demo\edtools_demo_data\stagepos_1014\crystal_0000\SMV\XDS.INP
 C:\demo\edtools_demo_data\stagepos_1261\crystal_0001\SMV\XDS.INP
 C:\demo\edtools_demo_data\stagepos_1283\crystal_0001\SMV\XDS.INP
Updated 16 files
Refine phases
Rerun autoindex, extract_xds_info and find_cell for the desired phases to be successfully indexed by XDS. All the other phases are hopefully excluded in that a phase with different enough unit cell will not be indexed successfully. There are however cases when different phases have similar unit cells, which cannot be told apart during this step.
[5]:
!edtools.autoindex
 !!! ERROR !!! WRONG TYPE OF INPUT FILE SPECIFIED
 !!! ERROR !!! WRONG TYPE OF INPUT FILE SPECIFIED
16 files named XDS.INP (subdir: None) found.

   4: C:\demo\edtools_demo_data\stagepos_0325\crystal_0000\SMV  # Mon Aug  1 21:03:22 2022
Spgr   69 - Cell      13.88     25.44     27.26     90.00     90.00     90.00 - Vol    9625.70

   #   dmax  dmin    ntot   nuniq   compl   i/sig   rmeas CC(1/2)     ISa   B(ov)
   4   9.30  0.80    3938    1852    69.0    3.24    20.2    99.4   11.45    8.21
   -   0.91  0.85     614     290    74.4    0.86   109.5    81.7


   5: C:\demo\edtools_demo_data\stagepos_0341\crystal_0000\SMV  # Mon Aug  1 21:03:24 2022
Spgr   69 - Cell      13.52     24.94     27.07     90.00     90.00     90.00 - Vol    9127.70

   #   dmax  dmin    ntot   nuniq   compl   i/sig   rmeas CC(1/2)     ISa   B(ov)
   5  10.88  0.80    2203    1029    40.4    3.84    11.7    99.9   27.38    9.78
   -   1.07  0.98     299     135    41.8    1.04   107.2    76.5


   8: C:\demo\edtools_demo_data\stagepos_0648\crystal_0001\SMV  # Mon Aug  1 21:03:28 2022
Spgr   69 - Cell      14.01     25.97     29.04     90.00     90.00     90.00 - Vol   10565.90

   #   dmax  dmin    ntot   nuniq   compl   i/sig   rmeas CC(1/2)     ISa   B(ov)
   8   7.14  0.80    1466     781    26.2    2.61    18.2    97.2    4.73    7.15
   -   0.84  0.80     142      92    19.9    0.98    62.3    52.7


   9: C:\demo\edtools_demo_data\stagepos_0849\crystal_0000\SMV  # Mon Aug  1 21:03:30 2022
Spgr   69 - Cell      15.10     26.02     26.72     90.00     90.00     90.00 - Vol   10498.34

   #   dmax  dmin    ntot   nuniq   compl   i/sig   rmeas CC(1/2)     ISa   B(ov)
   9   7.24  0.80    1994    1126    38.5    3.27    11.9    99.5   12.91    8.08
   -   0.98  0.90     322     166    41.2    1.27    70.2    89.0

  10: C:\demo\edtools_demo_data\stagepos_0905\crystal_0000\SMV -> Error in IDXREF: RETURN CODE IS IER=           0

  11: C:\demo\edtools_demo_data\stagepos_0905\crystal_0001\SMV  # Mon Aug  1 21:03:32 2022
Spgr   69 - Cell      13.83     25.80     28.73     90.00     90.00     90.00 - Vol   10251.27

   #   dmax  dmin    ntot   nuniq   compl   i/sig   rmeas CC(1/2)     ISa   B(ov)
  11   7.08  0.80    1591     808    28.2    2.88    17.1    98.1    6.24    7.63
   -   0.90  0.85     254     128    30.4    1.17    42.6    95.4


  12: C:\demo\edtools_demo_data\stagepos_0980\crystal_0000\SMV  # Mon Aug  1 21:03:34 2022
Spgr   69 - Cell      14.39     25.16     28.10     90.00     90.00     90.00 - Vol   10173.67

   #   dmax  dmin    ntot   nuniq   compl   i/sig   rmeas CC(1/2)     ISa   B(ov)
  12   5.12  0.80    1669     851    30.2    3.75    16.8    98.0    6.26    5.76
   -   0.85  0.80     153     109    25.3    1.34    46.1    68.5


  15: C:\demo\edtools_demo_data\stagepos_1283\crystal_0001\SMV  # Mon Aug  1 21:03:39 2022
Spgr   69 - Cell      13.54     25.23     27.30     90.00     90.00     90.00 - Vol    9326.07

   #   dmax  dmin    ntot   nuniq   compl   i/sig   rmeas CC(1/2)     ISa   B(ov)
  15   5.97  0.80    1620     563    21.7    6.15     8.4    99.8   11.79    7.17
   -   0.85  0.80     187      78    19.1    2.24    45.1    97.9
[6]:
!edtools.extract_xds_info
7 files named CORRECT.LP (subdir: None) found.
   1: C:\demo\edtools_demo_data\stagepos_0325\crystal_0000\SMV  # Mon Aug  1 21:03:22 2022
Spgr   69 - Cell      13.88     25.44     27.26     90.00     90.00     90.00 - Vol    9625.70

   2: C:\demo\edtools_demo_data\stagepos_0341\crystal_0000\SMV  # Mon Aug  1 21:03:24 2022
Spgr   69 - Cell      13.52     24.94     27.07     90.00     90.00     90.00 - Vol    9127.70

   3: C:\demo\edtools_demo_data\stagepos_0648\crystal_0001\SMV  # Mon Aug  1 21:03:28 2022
Spgr   69 - Cell      14.01     25.97     29.04     90.00     90.00     90.00 - Vol   10565.90

   4: C:\demo\edtools_demo_data\stagepos_0849\crystal_0000\SMV  # Mon Aug  1 21:03:30 2022
Spgr   69 - Cell      15.10     26.02     26.72     90.00     90.00     90.00 - Vol   10498.34

   5: C:\demo\edtools_demo_data\stagepos_0905\crystal_0001\SMV  # Mon Aug  1 21:03:32 2022
Spgr   69 - Cell      13.83     25.80     28.73     90.00     90.00     90.00 - Vol   10251.27

   6: C:\demo\edtools_demo_data\stagepos_0980\crystal_0000\SMV  # Mon Aug  1 21:03:34 2022
Spgr   69 - Cell      14.39     25.16     28.10     90.00     90.00     90.00 - Vol   10173.67

   7: C:\demo\edtools_demo_data\stagepos_1283\crystal_0001\SMV  # Mon Aug  1 21:03:39 2022
Spgr   69 - Cell      13.54     25.23     27.30     90.00     90.00     90.00 - Vol    9326.07

   #   dmax  dmin    ntot   nuniq   compl   i/sig   rmeas CC(1/2)     ISa   B(ov)
---------------------------------------------------------------------------------

   1   9.30  0.80    3938    1852    69.0    3.24    20.2    99.4   11.45    8.21  # C:\demo\edtools_demo_data\stagepos_0325\crystal_0000\SMV\CORRECT.LP
   -   0.91  0.85     614     290    74.4    0.86   109.5    81.7

   2  10.88  0.80    2203    1029    40.4    3.84    11.7    99.9   27.38    9.78  # C:\demo\edtools_demo_data\stagepos_0341\crystal_0000\SMV\CORRECT.LP
   -   1.07  0.98     299     135    41.8    1.04   107.2    76.5

   3   7.14  0.80    1466     781    26.2    2.61    18.2    97.2    4.73    7.15  # C:\demo\edtools_demo_data\stagepos_0648\crystal_0001\SMV\CORRECT.LP
   -   0.84  0.80     142      92    19.9    0.98    62.3    52.7

   4   7.24  0.80    1994    1126    38.5    3.27    11.9    99.5   12.91    8.08  # C:\demo\edtools_demo_data\stagepos_0849\crystal_0000\SMV\CORRECT.LP
   -   0.98  0.90     322     166    41.2    1.27    70.2    89.0

   5   7.08  0.80    1591     808    28.2    2.88    17.1    98.1    6.24    7.63  # C:\demo\edtools_demo_data\stagepos_0905\crystal_0001\SMV\CORRECT.LP
   -   0.90  0.85     254     128    30.4    1.17    42.6    95.4

   6   5.12  0.80    1669     851    30.2    3.75    16.8    98.0    6.26    5.76  # C:\demo\edtools_demo_data\stagepos_0980\crystal_0000\SMV\CORRECT.LP
   -   0.85  0.80     153     109    25.3    1.34    46.1    68.5

   7   5.97  0.80    1620     563    21.7    6.15     8.4    99.8   11.79    7.17  # C:\demo\edtools_demo_data\stagepos_1283\crystal_0001\SMV\CORRECT.LP
   -   0.85  0.80     187      78    19.1    2.24    45.1    97.9

Wrote 7 cells to file cells.xlsx
Wrote 7 cells to file cells.yaml
Wrote 7 entries to file filelist.txt (completeness > 10.0%, CC(1/2) > 90.0%)

Most likely lattice types:
  1 Lattice type `oF` (spgr:  22) was found   7 times (score:   14481)

 ** the score corresponds to the total number of indexed reflections.
[ ]:
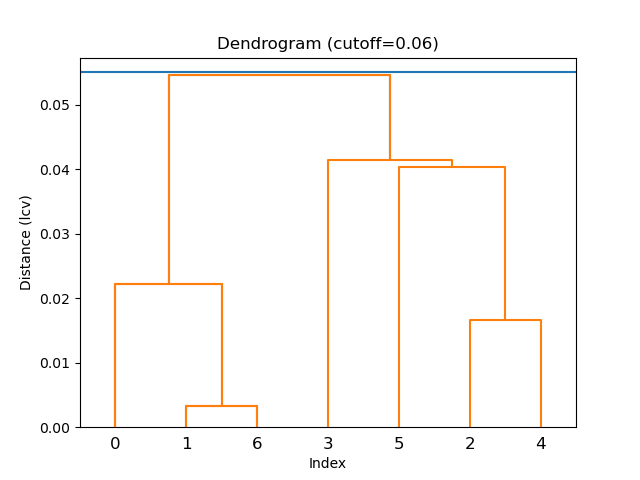
!edtools.find_cell cells.yaml --cluster --metric lcv
[7]:
Image('find_cell_step5.png', embed=True)
[7]:
Console Output
Linkage method = average
Cutoff distance = 0.0551
Distance metric = lcv

----------------------------------------

Cluster #1 (7 items)
    1 [  13.97   25.49   27.12   90.00   90.00   90.00]  Vol.: 9657.9
    2 [  13.53   25.01   27.18   90.00   90.00   90.00]  Vol.: 9195.6
    3 [  14.03   26.02   29.55   90.00   90.00   90.00]  Vol.: 10790.3
    4 [  14.94   26.14   26.94   90.00   90.00   90.00]  Vol.: 10522.3
    5 [  13.85   25.79   29.03   90.00   90.00   90.00]  Vol.: 10364.0
    6 [  14.52   24.95   28.11   90.00   90.00   90.00]  Vol.: 10184.6
    7 [  13.53   25.13   27.15   90.00   90.00   90.00]  Vol.: 9233.7
 ---
Mean: [  14.05   25.50   27.87   90.00   90.00   90.00]  Vol.: 9992.6
 Min: [  13.53   24.95   26.94   90.00   90.00   90.00]  Vol.: 9195.6
 Max: [  14.94   26.14   29.55   90.00   90.00   90.00]  Vol.: 10790.3

Wrote cluster 1 to file `cells_cluster_1_7-items.yaml`
Generate the input file for XSCALE
This command generates the desired unit cell cluster for XSCALE.
[8]:
!edtools.make_xscale cells_cluster_1_7-items.yaml -c 14.05 25.50 27.87 90.00 90.00 90.00 -s 69
Loaded 7 cells
Lowest possible symmetry for 69 (oF): 22

Using:
  SPACE_GROUP_NUMBER= 69
  UNIT_CELL_CONSTANTS= 14.050 25.500 27.870 90.000 90.000 90.000

Wrote file XSCALE.INP
Wrote file XDSCONV.INP
Run XSCALE
XSCALE calculates the correlation coefficients between different datasets.
[9]:
!wsl xscale
 ***** XSCALE ***** (VERSION Jan 10, 2022  BUILT=20220220)   1-Aug-2022
 Author: Wolfgang Kabsch
 Copy licensed until 31-Mar-2023 to
  academic users for non-commercial applications
 No redistribution.


 ******************************************************************************
                              CONTROL CARDS
 ******************************************************************************

 SNRC= 2
 SAVE_CORRECTION_IMAGES= FALSE
 SPACE_GROUP_NUMBER= 69
 UNIT_CELL_CONSTANTS= 14.050 25.500 27.870 90.000 90.000 90.000

 OUTPUT_FILE= MERGED.HKL

     INPUT_FILE= edtools_demo_data/stagepos_0325/crystal_0000/SMV/XDS_ASCII.HKL
     INCLUDE_RESOLUTION_RANGE= 20 0.8

     INPUT_FILE= edtools_demo_data/stagepos_0341/crystal_0000/SMV/XDS_ASCII.HKL
     INCLUDE_RESOLUTION_RANGE= 20 0.8

     INPUT_FILE= edtools_demo_data/stagepos_0648/crystal_0001/SMV/XDS_ASCII.HKL
     INCLUDE_RESOLUTION_RANGE= 20 0.8

     INPUT_FILE= edtools_demo_data/stagepos_0849/crystal_0000/SMV/XDS_ASCII.HKL
     INCLUDE_RESOLUTION_RANGE= 20 0.8

     INPUT_FILE= edtools_demo_data/stagepos_0905/crystal_0001/SMV/XDS_ASCII.HKL
     INCLUDE_RESOLUTION_RANGE= 20 0.8

     INPUT_FILE= edtools_demo_data/stagepos_0980/crystal_0000/SMV/XDS_ASCII.HKL
     INCLUDE_RESOLUTION_RANGE= 20 0.8

     INPUT_FILE= edtools_demo_data/stagepos_1283/crystal_0001/SMV/XDS_ASCII.HKL
     INCLUDE_RESOLUTION_RANGE= 20 0.8


 THE DATA COLLECTION STATISTICS REPORTED BELOW ASSUMES:
 SPACE_GROUP_NUMBER=   69
 UNIT_CELL_CONSTANTS=    14.05    25.50    27.87  90.000  90.000  90.000


 ALL DATA SETS WILL BE SCALED TO edtools_demo_data/stagepos_0325/crystal_0000/SMV/XDS_ASCII.HKL


 ******************************************************************************
                    READING INPUT REFLECTION DATA FILES
 ******************************************************************************

 DATA    MEAN       REFLECTIONS        INPUT FILE NAME
 SET# INTENSITY  ACCEPTED REJECTED
   1  0.3010E+02     3938      0  edtools_demo_data/stagepos_0325/crystal_0000/SMV/XDS_ASCII.HKL
   2  0.1368E+02     2205      0  edtools_demo_data/stagepos_0341/crystal_0000/SMV/XDS_ASCII.HKL
   3  0.9168E+02     1453      0  edtools_demo_data/stagepos_0648/crystal_0001/SMV/XDS_ASCII.HKL
   4  0.4279E+02     1931      0  edtools_demo_data/stagepos_0849/crystal_0000/SMV/XDS_ASCII.HKL
   5  0.8542E+02     1590      0  edtools_demo_data/stagepos_0905/crystal_0001/SMV/XDS_ASCII.HKL
   6  0.1676E+03     1662      0  edtools_demo_data/stagepos_0980/crystal_0000/SMV/XDS_ASCII.HKL
   7  0.1915E+03     1620      0  edtools_demo_data/stagepos_1283/crystal_0001/SMV/XDS_ASCII.HKL


 ******************************************************************************
                OVERALL SCALING AND CRYSTAL DISORDER CORRECTION
 ******************************************************************************

      CORRELATIONS BETWEEN INPUT DATA SETS AFTER CORRECTIONS

 DATA SETS  NUMBER OF COMMON  CORRELATION   RATIO OF COMMON   B-FACTOR
  #i   #j     REFLECTIONS     BETWEEN i,j  INTENSITIES (i/j)  BETWEEN i,j

    1    2         119           0.936            3.1896         0.1394
    1    3          87           0.980            0.5337        -0.4854
    2    3         164           0.945            0.1982        -0.5975
    1    4         216           0.925            1.0428        -0.6421
    2    4         116           0.972            0.3076        -0.4582
    3    4         131           0.894            1.6716         0.0043
    1    5          80           0.959            0.3779         0.1598
    2    5         147           0.970            0.1872        -0.3822
    3    5         218           0.988            0.9850         0.0336
    4    5          96           0.928            0.6114         0.1442
    1    6         206           0.955            0.1970        -0.4620
    2    6          81           0.949            0.0917        -0.7741
    3    6          91           0.934            0.6363        -0.3722
    4    6         106           0.927            0.2401        -0.0297
    5    6          81           0.866            0.5334        -0.1957
    1    7          35           0.965            0.4893        -1.1586
    2    7         131           0.981            0.1113        -1.0633
    3    7         158           0.984            0.5449        -0.3181
    4    7          45           0.833            0.4069        -0.1510
    5    7         196           0.987            0.5649        -0.4493
    6    7          67           0.846            1.6099        -0.5928


 K*EXP(B*SS) = Factor applied to intensities
    SS       = (2sin(theta)/lambda)^2

      K        B           DATA SET NAME
  1.000E+00   0.000    edtools_demo_data/stagepos_0325/crystal_0000/SMV/XDS_ASCII.HKL
  2.961E+00   0.170    edtools_demo_data/stagepos_0341/crystal_0000/SMV/XDS_ASCII.HKL
  5.374E-01  -0.365    edtools_demo_data/stagepos_0648/crystal_0001/SMV/XDS_ASCII.HKL
  9.426E-01  -0.465    edtools_demo_data/stagepos_0849/crystal_0000/SMV/XDS_ASCII.HKL
  5.063E-01  -0.243    edtools_demo_data/stagepos_0905/crystal_0001/SMV/XDS_ASCII.HKL
  2.304E-01  -0.530    edtools_demo_data/stagepos_0980/crystal_0000/SMV/XDS_ASCII.HKL
  3.491E-01  -0.812    edtools_demo_data/stagepos_1283/crystal_0001/SMV/XDS_ASCII.HKL

 ******************************************************************************
    CORRECTION PARAMETERS FOR THE STANDARD ERROR OF REFLECTION INTENSITIES
 ******************************************************************************

 The variance v0(I) of the intensity I obtained from counting statistics is
 replaced by v(I)=a*(v0(I)+b*I^2). The model parameters a, b are chosen to
 minimize the discrepancies between v(I) and the variance estimated from
 sample statistics of symmetry related reflections. This model implicates
 an asymptotic limit ISa=1/SQRT(a*b) for the highest I/Sigma(I) that the
 experimental setup can produce (Diederichs (2010) Acta Cryst D66, 733-740).
 Often the value of ISa is reduced from the initial value ISa0 due to systematic
 errors showing up by comparison with other data sets in the scaling procedure.
 (ISa=ISa0=-1 if v0 is unknown for a data set.)

     a        b          ISa    ISa0   INPUT DATA SET
 3.014E+00  1.258E-02    5.14   11.45 edtools_demo_data/stagepos_0325/crystal_0000/SMV/XDS_ASCII.HKL
 2.201E+00  3.743E-03   11.02   27.38 edtools_demo_data/stagepos_0341/crystal_0000/SMV/XDS_ASCII.HKL
 8.809E+00  2.191E-02    2.28    4.73 edtools_demo_data/stagepos_0648/crystal_0001/SMV/XDS_ASCII.HKL
 6.242E+00  1.032E-02    3.94   12.91 edtools_demo_data/stagepos_0849/crystal_0000/SMV/XDS_ASCII.HKL
 7.668E+00  1.817E-02    2.68    6.25 edtools_demo_data/stagepos_0905/crystal_0001/SMV/XDS_ASCII.HKL
 1.379E+01  1.128E-02    2.53    6.26 edtools_demo_data/stagepos_0980/crystal_0000/SMV/XDS_ASCII.HKL
 7.838E-01  1.921E-01    2.58   11.79 edtools_demo_data/stagepos_1283/crystal_0001/SMV/XDS_ASCII.HKL


 FACTOR TO PLACE ALL DATA SETS TO AN APPROXIMATE ABSOLUTE SCALE 0.143057E+03
 (ASSUMING A PROTEIN WITH 50% SOLVENT)


 ******************************************************************************
  STATISTICS OF SCALED OUTPUT DATA SET : MERGED.HKL
  FILE TYPE:         XDS_ASCII      MERGE=FALSE          FRIEDEL'S_LAW=TRUE

        13 OUT OF     14399 REFLECTIONS REJECTED
     14386 REFLECTIONS ON OUTPUT FILE

 ******************************************************************************
 DEFINITIONS:
 R-FACTOR
 observed = (SUM(ABS(I(h,i)-I(h))))/(SUM(I(h,i)))
 expected = expected R-FACTOR derived from Sigma(I)

 COMPARED = number of reflections used for calculating R-FACTOR
 I/SIGMA  = mean of intensity/Sigma(I) of unique reflections
            (after merging symmetry-related observations)
 Sigma(I) = standard deviation of reflection intensity I
            estimated from sample statistics

 R-meas   = redundancy independent R-factor (intensities)
            Diederichs & Karplus (1997), Nature Struct. Biol. 4, 269-275.

 CC(1/2)  = percentage of correlation between intensities from
            random half-datasets. Correlation significant at
            the 0.1% level is marked by an asterisk.
            Karplus & Diederichs (2012), Science 336, 1030-33
 Anomal   = percentage of correlation between random half-sets
  Corr      of anomalous intensity differences. Correlation
            significant at the 0.1% level is marked.
 SigAno   = mean anomalous difference in units of its estimated
            standard deviation (|F(+)-F(-)|/Sigma). F(+), F(-)
            are structure factor estimates obtained from the
            merged intensity observations in each parity class.
  Nano    = Number of unique reflections used to calculate
            Anomal_Corr & SigAno. At least two observations
            for each (+ and -) parity are required.


 cpu time used by XSCALE        0.2 sec
 elapsed wall-clock time        0.2 sec
Intensity-based clustering
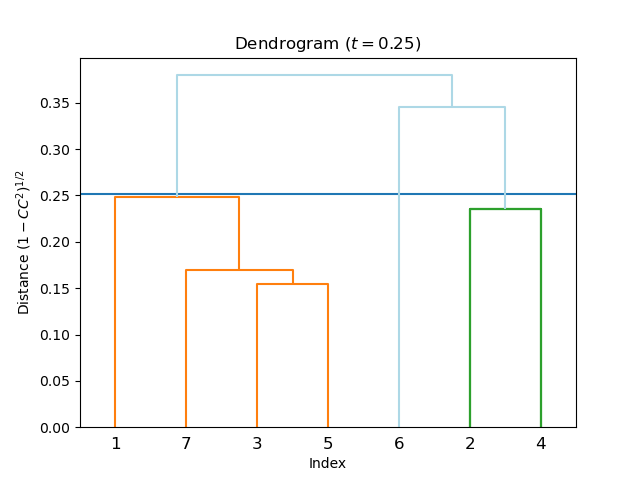
Run intensity-based clustering to further filter out datasets with low correlation (to remove poor quality datasets), or from a different phase that with similar enough unit cell. Cut-off on the dendrogram is selected manually. A number below 0.4 can be a good starting choice.
In the end, integration results from datasets corresponding to different clusters are automatically copied to different folders after running clustering. The merged intensities in file shelx.hkl can be used for structure determination.
[ ]:
!edtools.cluster
[10]:
Image('intensity_cluster.png', embed=True)
[10]:
Console Output
Running XSCALE on cluster 1
Running XSCALE on cluster 2

Clustering results

Cutoff distance: 0.252
Equivalent CC(I): 0.968
Method: average

  #  N_clust   CC(1/2)    N_obs   N_uniq   N_poss    Compl.   N_comp    R_meas    d_min  i/sigma  | Lauegr.  prob. conf.  idx
  2**      2     99.8*     4111     1546     2789     55.4      3723    0.143*     0.80     3.27
  1***     4     97.3*     8599     2496     2782     89.7*     8220    0.270*     0.80     2.85
(Sorted by 'Completeness')

Cluster 1: [1, 3, 5, 7]
Cluster 2: [2, 4]
Instruction for using on your own data
Install edtools and all software dependencies on your system
Put all your 3D ED datasets in one folder. All the 3D ED datasets are expected to be in some XDS readable image format, e.g. SMV. A correctly configured XDS.INP file is also expected for each dataset.
Open Windows command prompt from the root directory which contains all the datasets
Follow the demo